


This is a take on how I approach the foundations of data. It is not a technical guide as much as it is a perspective or a personal hack looking at what data is. I started writing these articles to think aloud about data, and so these are more like my personal notes. Anybody is welcome to correct on my thinking revealed here, if wrong.
Data Everywhere Perspective
The standard definition of data is that it is a collection of factual information that can be used to reason or calculate. A singular fact is known as a data point or datum. I'm training myself to see data everywhere. It is a matter of perspective - we do it subconsciously already- our bodies and brains are constantly collecting and analyzing data through all our five senses. For example, our skin senses the temperature of the air around us, and our brains interprets the collected information into feelings of hot or cold. Our eyes collect reflected light from the bodies around us, and our brain processes them into visual imagery. We could just keep piling the examples on.
I'll give one more example as to how see data in our everyday lives. Data just doesn't refer to temperatures being recorded, weather being forecast, surveys being filled out, sports stats. Data encompasses more than just that. Data can be a collection of factual information just about anything. Let's take the example of a water bottle. There are various different classes of data that can be gleaned from it. Let's start with the labels, and names people may have for this kind of a bottle. Then we can look at the physical characteristics of the said bottle - height, weight, shape, volume. Then we can move on to the material characteristics - melting point, tensile strength, and so on.

Quokka bottle from Unsplash
We can keep going on until we have squeezed every data point from the bottle. But we will stop here because we gotta ask ourselves - does data come in different forms that can be captured or encoded so as to make sense of and analyze it? The short answer is yes.
To continue with the flow of examples, my name is Ajay and that is one form of data, and my age which is 26 at the time of this writing is a different form of data, in the sense that these two pieces of information make sense on their own, however, they cannot be put together to make sense - as one is a word, and the other is a number. This means data can be broken down into different forms depending upon the nature of the information being collected.
What are the different data formats?
Data can exist in two broad formats - structured and unstructured. Structured data is data organized according to predefined data models (i.e., flat model - spreadsheets, relational model - mySQL, MariaDB and so on). Unstructured data, as it goes, is data that is not arranged in any particular fashion but is collected as raw as it comes. Examples include speech, sensor data, video files, images, and so on.
Note: Data formats and types have different definitions. Formats are discussed here and have to do with how we look at data from an analytical point of view while data types have more to do with how computers recognize data. For example, a computer recognizes data as a number (integer or float), a string, character (single letters),or Boolean (true or false).
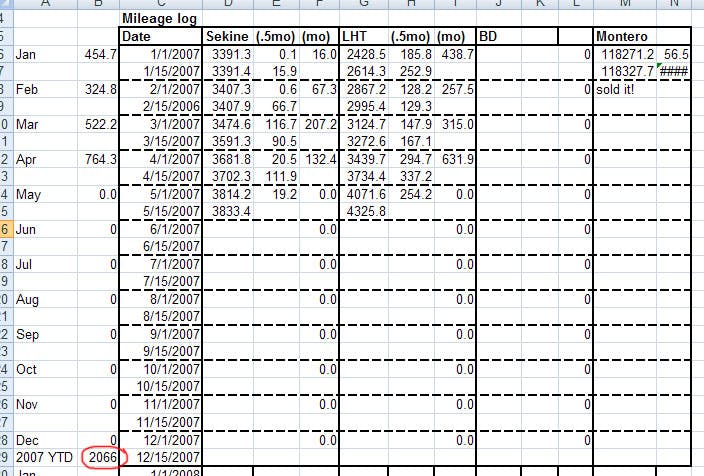
This spreadsheet with data on mileage is an example of structured data. Picture from Flickr
As such structured and unstructured data can consist of categorical (or qualitative) or numerical (or quantitative) data.

A tweet is an example of unstructured data. Picture from Unsplash
Categorical/Qualitative data essentially refers to every data format that is the least mathematical in nature upon which we can only do a few computing tasks. This format can be broken down into two distinct sub-formats - nominal and ordinal.
Nominal typically includes names, or labels which can be used to describe the state of an object, idea, or a person. For example, we can describe an object as heavy, cuboid, and hot. We can describe person as tall, married, a student, English-speaking, and so on. Nominal data could include numbers, letters or words but we can't perform mathematical operations on them such as computing a mean, median or a standard deviation, because it doesn't make any true sense to do that.
For example, what is the mean of all the names on this list would be a question that makes no sense. However, there is one operation that can be carried out - calculating the frequency of certain words that repeat in a given sample. This is helpful especially in analyzing unstructured data such as tweets, speeches, and transcripts.
Ordinal, on the other hand can refer to numbers that can be ordered in a particular order so as to capture certain information, however the difference between values don't matter. For example, we describe the top 10 sprinters in the world using rankings - which is ordinal data.
Numerical/Quantitative data refers to data that can be mathematically modelled or derived upon which almost mathematical operations can be carried out. Quantitative data can be further classified into two sub-formats -discrete and continuous.
Discrete data are data values that are distinct and separate - which can't be measured but counted. Counting the number of people, coin flips fall into discrete data.
Continuous data are values that can only be measured using certain established standards or techniques. For example, it could be measuring the distance between two points, or the temperature in a room. Continuous data can further be broken down into two formats - interval and ratio.
Interval data typically refers to data where there is order and the difference between two values makes sense but they don't have an absolute zero which eliminates the possibility to carry out multiplication, division or calculation of ratios. Addition and subtraction are the only mathematical operations possible. Examples of interval data include temperature data in Celsius and Fahrenheit (temperature measured in kelvin wouldn't be interval data as kelvin captures the possibility of no temperature where there is no heat (0 kelvin).
Ratio data also are data with order where values have the same difference and possess an absolute zero. Examples include height, length, mass, and so on.
With data, the different formats can be classified based on the extent of mathematical operations that can be carried out on them. As readily observable, there is a movement from mathematically lean formats (nominal & ordinal) towards more mathematically-flexible ones (interval & ratio). Now, with the basics of data covered here, we can be confident enough to venture further into the steps involved in data analysis.